
+ Case Studies
Every decision,
simulated first.
A record of operating problems we modelled, the assumptions we stated, and the decisions plants took as a result.
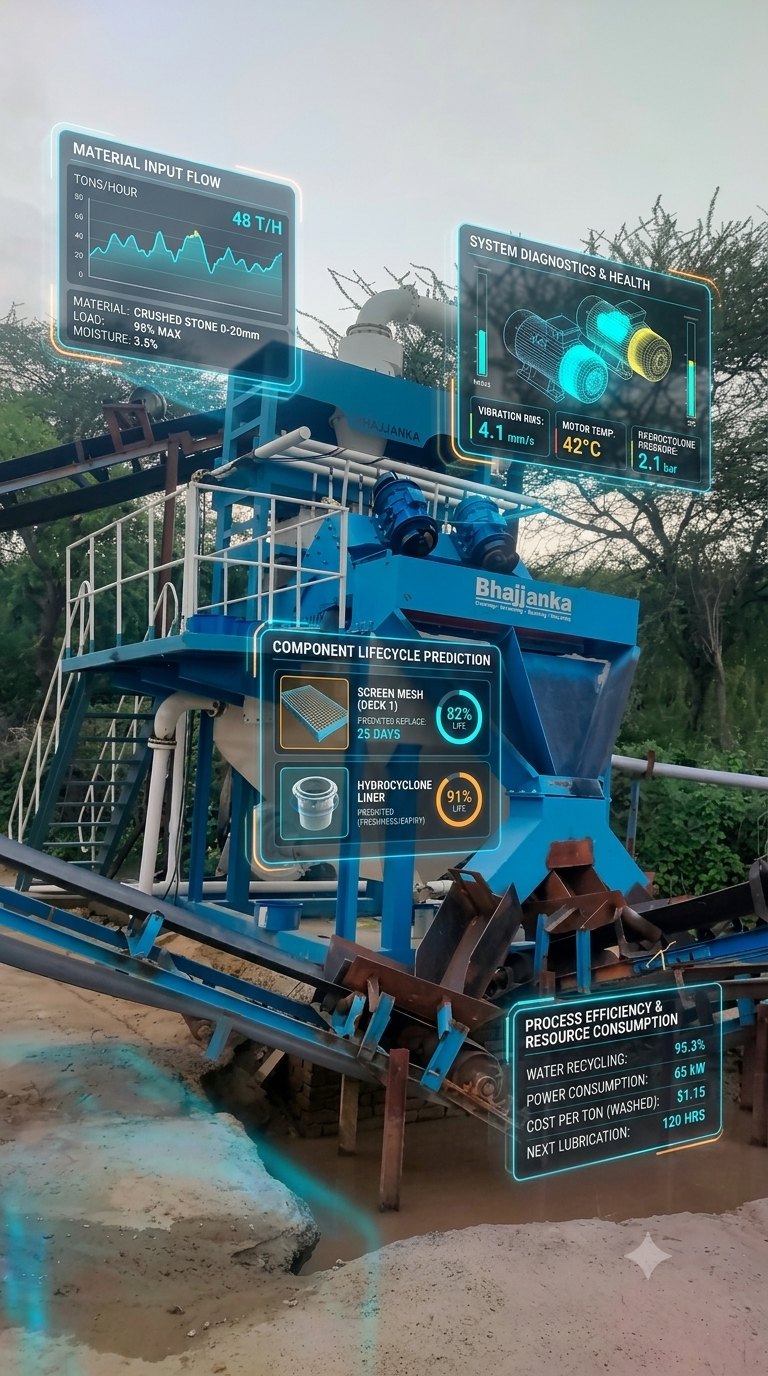
Plant Intelligence Made Visible
Material flow, vibration, pressure, component life, water recovery and energy indicators shown in one operating view.
Open full visual ↗SIMLAB™ Plant Diagnostics
A short mobile-format engineering visual showing how operating data becomes actionable plant intelligence.
Open full visual ↗Hydrocyclone Fastener Retrofit
127.4 maintenance hours/year potential recovery from an 84-node fastener audit, modelled against vibration load and access time before a retrofit was approved.
Read the report ↗Sand-Washing Water Balance
Product split, cyclone recovery and recirculation mapped before commissioning, giving the plant a water balance it could design piping and pumps against.
Read the report ↗Slurry Pipeline Selection
Diameter, head loss, velocity and wear reviewed as one pump-and-pipe system, so the final selection matched real duty instead of a supplier's default sizing.
Read the report ↗Have a similar operating problem?
Request a simulation ↗Have an operating problem?